
Key Concepts Study Tool: Chapter 10
Click on each concept below to check your understanding.
1. Hypotheses
- Research/alternative hypothesis (Ha or H1, H2, H3, etc.): Usually states that there is a relationship or specific directional relationship between variables.
- A null hypothesis (H0): A statement of no relationship, or that the sample mean will not be significantly different from the population mean.
- Directional: x̄ > μ or x̄ < μ
- Non-directional: x̄ ≠ μ or x̄ = μ
- Type One Error: To reject the null hypothesis when it is actually true
- Type Two Error: Fail to reject the null hypothesis when it is not true
- One-Tailed Hypothesis Test: Used when you are predicting directionality.
- Two-Tailed Hypothesis Test: Used when you are not interested in directionality.
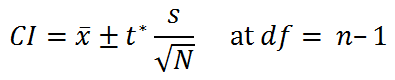
2. Calculating Confidence Intervals in the One-Sample Case
- To analyze samples of normal populations with an unknown mean (μ), construct the confidence interval by attaching a range of plausible values to the sample mean (x ̅), using the following equation:
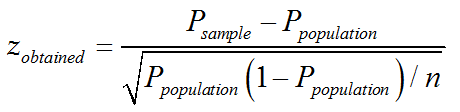
3. Single Sample Proportions
- To calculate z with proportions, use this equation:
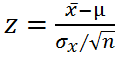
4. The Steps: Hypothesis Testing with a Large Sample and a Population
- State the null and the alternative or research hypotheses.
- Decide whether a one-tailed or two-tailed test is more appropriate, and locate the appropriate critical z-statistic values from Appendix A.
- Compute zobserved with the following equations:
 OR
OR 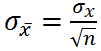 then
then 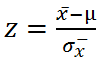
- Compare zobserved with the zcritical values. If zobserved exceeds zcritical, then you must reject H0; if it does not, then you fail to reject the null hypothesis.
5. The Steps: Hypothesis Testing with a Small Sample and a Population
- State the null and the alternative or research hypotheses.
- Decide whether a one-tailed or two-tailed test is more appropriate, pick your confidence level, state your df and locate the appropriate t-statistic values from Appendix B.
- Compute tobserved with the following equations:
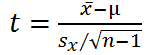 OR
OR 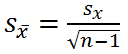 then
then 
- Compare tobserved with the tcritical values taken from Appendix B at df = n – 1. If tobserved exceeds tcritical, then you must reject H0; if it does not, then you fail to reject the null hypothesis.
6. t-Test for the Same Sample Measured Twice
- For each column, calculate the average (X̄1 and X̄2).
- For each observation, calculate the difference between X1 and X2 (di = Xi1 – Xi2) then sum that value (Ʃdi. Square the difference for each person and sum the values.
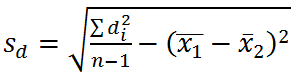
- Calculate the standard deviation:
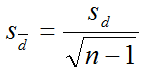
- Calculate the standard error of difference between means:
- Use those values to calculate the t-value using: