Background Reading
At first glance, you might assume that it would be best to maintain the population at as high a level as possible—that is, close to . However, if the harvest is to be sustainable, the population must replace the lost individuals. This suggests that not only is the current number important but so is the rate of growth of the population. At any one moment in time, the growth rate is measured by a line tangent to the growth curve. The growth rate of the population changes throughout the time course of a population in logistic growth. Note the significant differences in growth rate at different points in the growth curve. Another way of looking at this relationship is to plot the growth rate itself as a function of (see Figure 2). Recruitment, and maximum sustainable yield occurs at .
We can quantify the harvest strategy that will result in maximum sustainable yield with a form of the logistic equation
The population size at time equals the current population size () + new recruits. Recruitment is determined by the growth rate () reduced by an amount proportional to how near the population stands or ().
We can add a term to this equation that quantifies the intensity of harvest. To incorporate these measures into the logistic equation, we reduce the growth rate by an amount proportional to the harvest. In a fixed-effort harvest we limit the harvest by limiting the length of the harvest season, the methods of harvest, and so forth. We incorporate this limit as the proportion of the population taken (). The product of that successful effort and the current population is the number of individuals harvested.
The goal is to set the quota or the effort such that the population is maintained at a value where recruitment of new individuals is maximized.
For additional background information, please see Section 18.2 of Chapter 18, What Anthropogenic Mortality Factors Lead to Extinction? and Do the Math in Chapter 18.
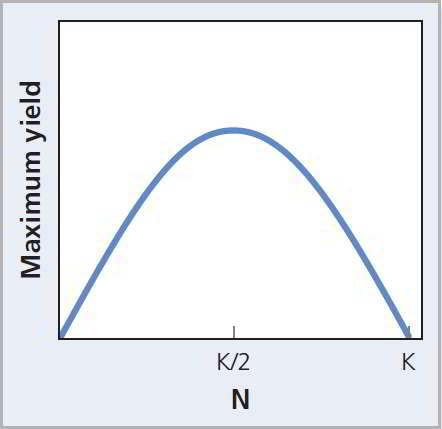
Figure 2 Maximum sustainable yield. The maximum sustainable yield is found in a graph of population growth rate as a function of .