Background reading: How do density-dependent changes affect population growth?
We model density-dependent effects with a simple algebraic manipulation of the basic equation for population growth. Recall that for populations with overlapping generations, we use the equation
or the integral form,
In these equations, is the intrinsic rate of growth of the population. Recall that the value of depends on the per capita birth and death rates ( and ). The change in the population size () is determined by the equation:
We replace with the variable , the instantaneous growth rate (also known as the intrinsic rate of increase):
Under favorable conditions, the population grows exponentially. If we include the Malthusian argument that resources will eventually limit population growth, this exponential growth cannot continue indefinitely. Eventually growth must slow, stop, or even decline. We modify the growth equation to include this phenomenon with this addition:
where is the carrying capacity, the maximum population size sustainable by the resources available. Notice how this equation behaves. If : becomes negative; that is, the population declines. If : is positive, the population grows. If : ; the population is stable. Our equation now includes a density-dependent effect: at high density, the growth rate is negative; at low density, the growth rate is positive (see Figure 9.7). Notice that even when a population reaches K, there may be some random fluctuation above and below K.
For additional background information, please see Section 9.1 of Chapter 9, How Do Density-Dependent and Density-Independent Factors Affect Populations?
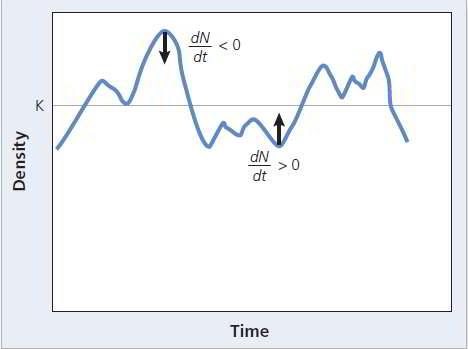
Figure 9.7 Carrying capacity. When the population is above the carrying capacity, density-dependent factors result in . If it is below , is positive.