Background reading: The mathematics of allometry
We begin with a general equation for the relationship between two components of an organism and .
For example, let be a measure of metabolic rate (a key component of production efficiency) and let be a measure of body size. If two aspects of an organism change in the same way, their relationship is isometric. Figure 1a shows a hypothetical isometric relationship between basal metabolic rate and body size. In this example, each increase in body size leads to a twofold increase in metabolic rate. The equation
describes this isometric situation. The value of defines an isometric relationship—the value of is determined only by the multiplicative coefficient . The key feature of isometry is that the proportional relationship of and do not change as increases; in this example, is always related to by a factor of 2.
Allometric relationships occur when . When this occurs, and are no longer related in linear fashion (Figure 1b). When , the allometric relationship is called positive allometry or hyperallometry. The relationship is negative allometry or hypoallometry if .
Note that allometric relationships result in linear relationships when the two traits are plotted logarithmically (Figure 1c). They can thus be represented in the logarithmic equation below.
The surface-to-volume ratio also plays a role in the production efficiency of homeotherms. Surface area scales as the square of the linear dimension; mass (volume) scales as its cube. Thus, the surface/volume ratio of small animals is large compared to that of large animals. We can place this relationship in the mathematical context of allometry as follows. The volume of an organism increases as the cube of its linear dimension ():
( is a constant). The surface increases as the square of :
In order to determine the allometric equation, we manipulate the equation for surface area in order to represent it with the same exponent as the volume equation. Because surface area grows only two-thirds as fast as volume, the surface area is also given by the equation
Because , we can substitute
to obtain an equation in the standard allometric form where .
For additional background information, please see Do the Math in Chapter 16 of your textbook.
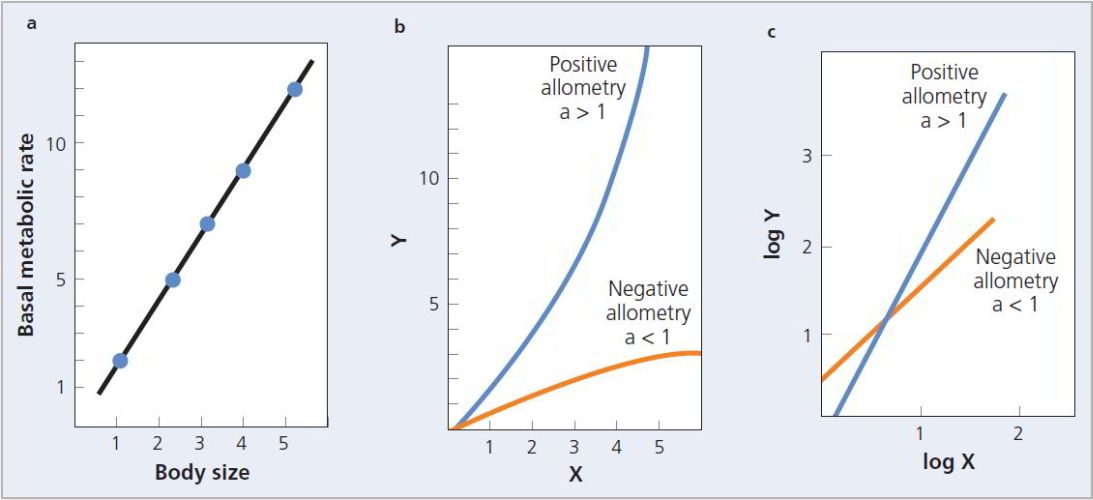
Figure 1 Possible relationships between body size and metabolic rate. (a) An isometric relationship. (b) Positive and negative allometry. (c) On a log-log plot, allometric relationships result in straight lines.